
Admin dashboard
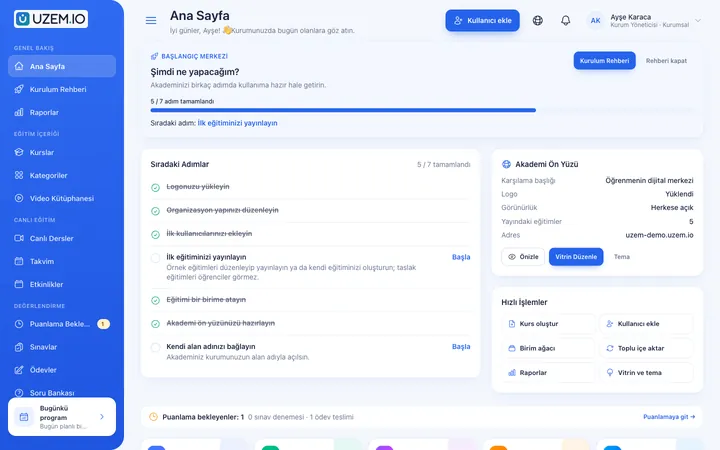
As soon as you enter the dashboard, you see a summary of learners, courses, sales and live sessions.
Reporting
Who watched which lesson and for how long, how they did on the exam, who attended the live session, how much you sold this month? It's all in ready-made reports; export as CSV when needed.
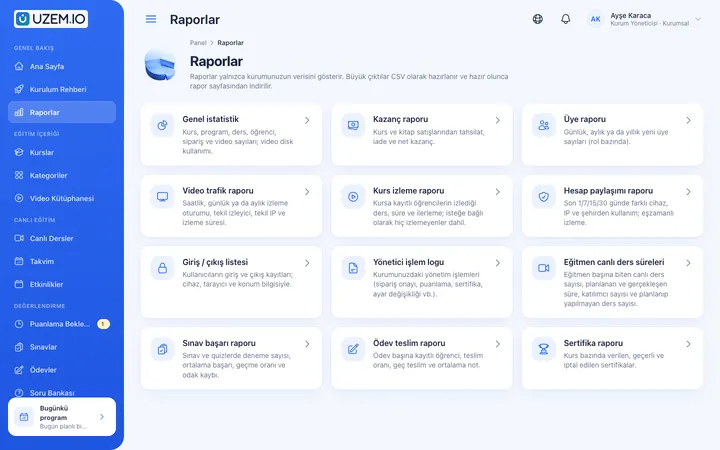
Every report is filtered by date range, shown paginated on screen and can be exported as CSV.
As soon as you enter the dashboard, you see a summary of learners, courses, sales and live sessions.
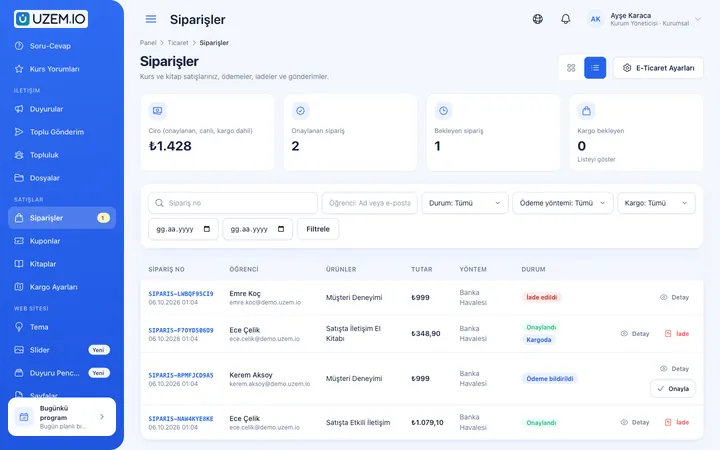
Term revenue, refunds and net turnover; course and book sales separately.
Large reports don't hold up the request: exports are prepared in the queue, and you download them when they're ready.
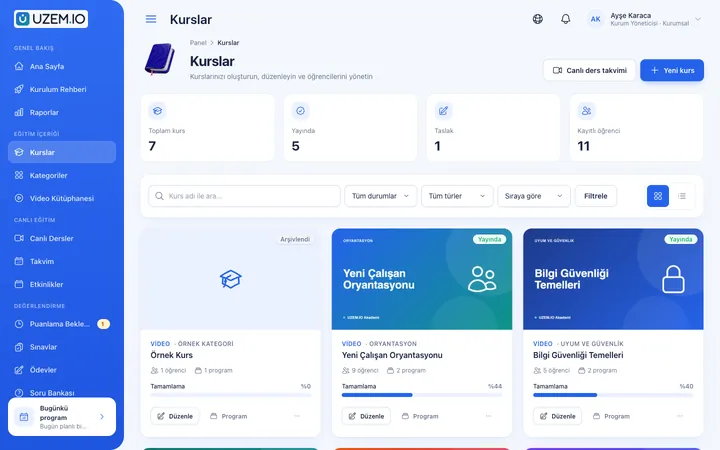
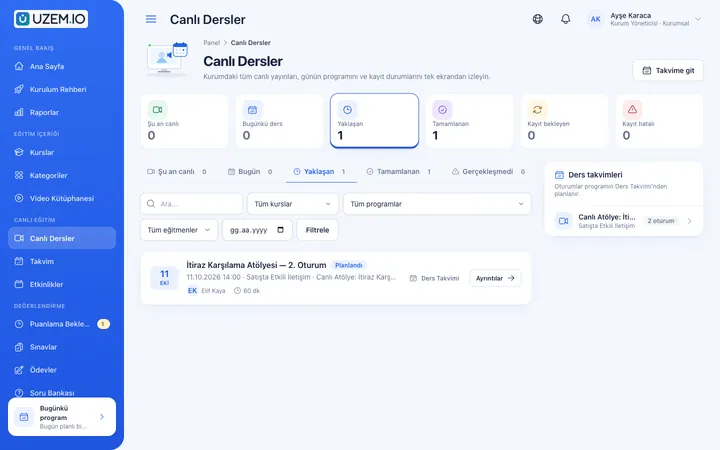
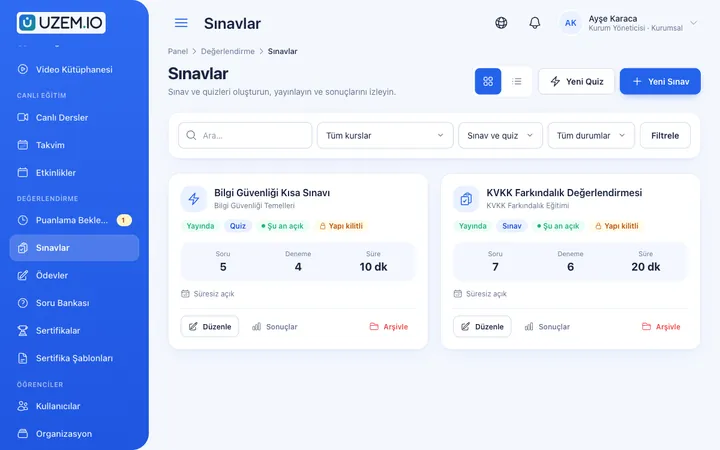
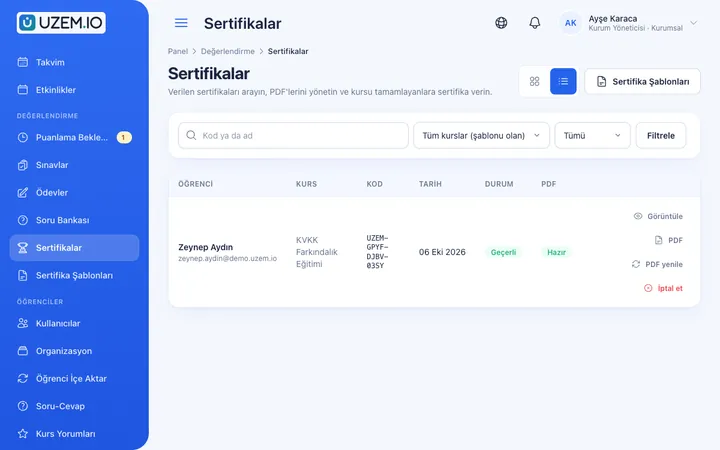
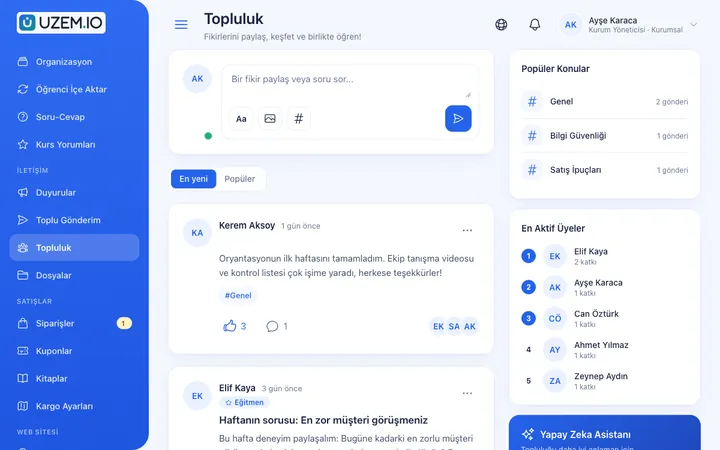
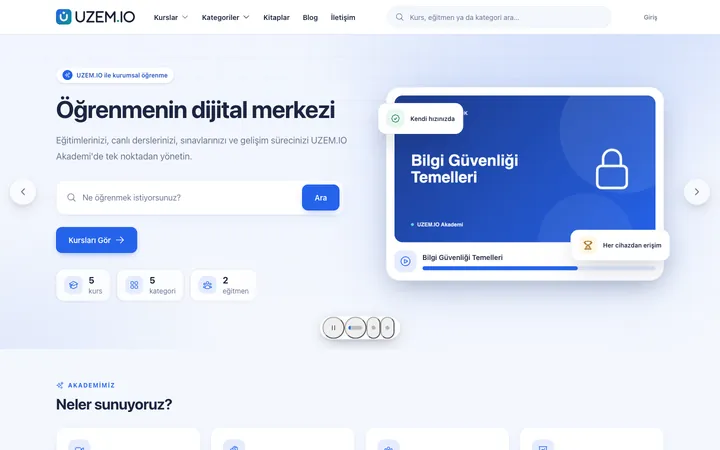
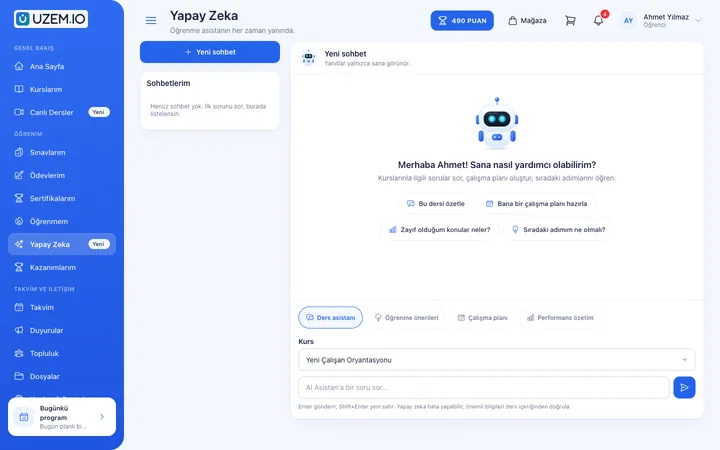
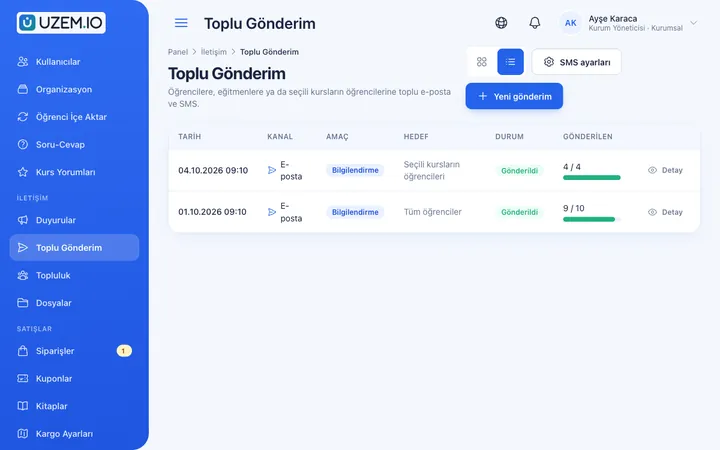
Screenshots are taken from UZEM's real interface with sample data.
If the answer you're looking for isn't here, write to us and our team will help.
Help centerReports are available to the organization admin. Each report reads only your own organization's data.
Yes. Reports are exported as CSV and open in Excel or similar spreadsheet programs. Exports are prepared in the queue, and you download them when they're ready.
Yes. When you check the “include those who never watched” option in the course viewing report, learners enrolled in the course who never watched are listed too.
The account sharing report shows usage from different devices, IPs and cities, as well as concurrent viewing, over the last 1, 7, 15 or 30 days.
See how reports work with the sample content in your trial academy.
Strictly necessary cookies are used for the site to work. Analytics and marketing cookies are enabled only with your consent. Cookie policy